Food for all: mission impossible?

One of the greatest feats of our time is to guarantee the food security on the planet. According to FAO (Food and Agriculture Organization of the United Nations):

“Food security exists when all people, at all times, have physical, social and economic access to sufficient, safe and nutritious food which meets their dietary needs and food preferences for an active and healthy life.1

The growing population

Human population continues to grow, especially in developing countries, and in 2050 9 billion people will populate the earth. How to feed 9 billion people is generating commotion not only regarding the need of producing more and “better” but also when addressing awareness about food waste and unequal food distribution.2

The figure below shows how the population increased during the past 65 years and the projections for 2050.3

a Estimates, 1950-2015. b Medium fertility variant, 2015-2100.
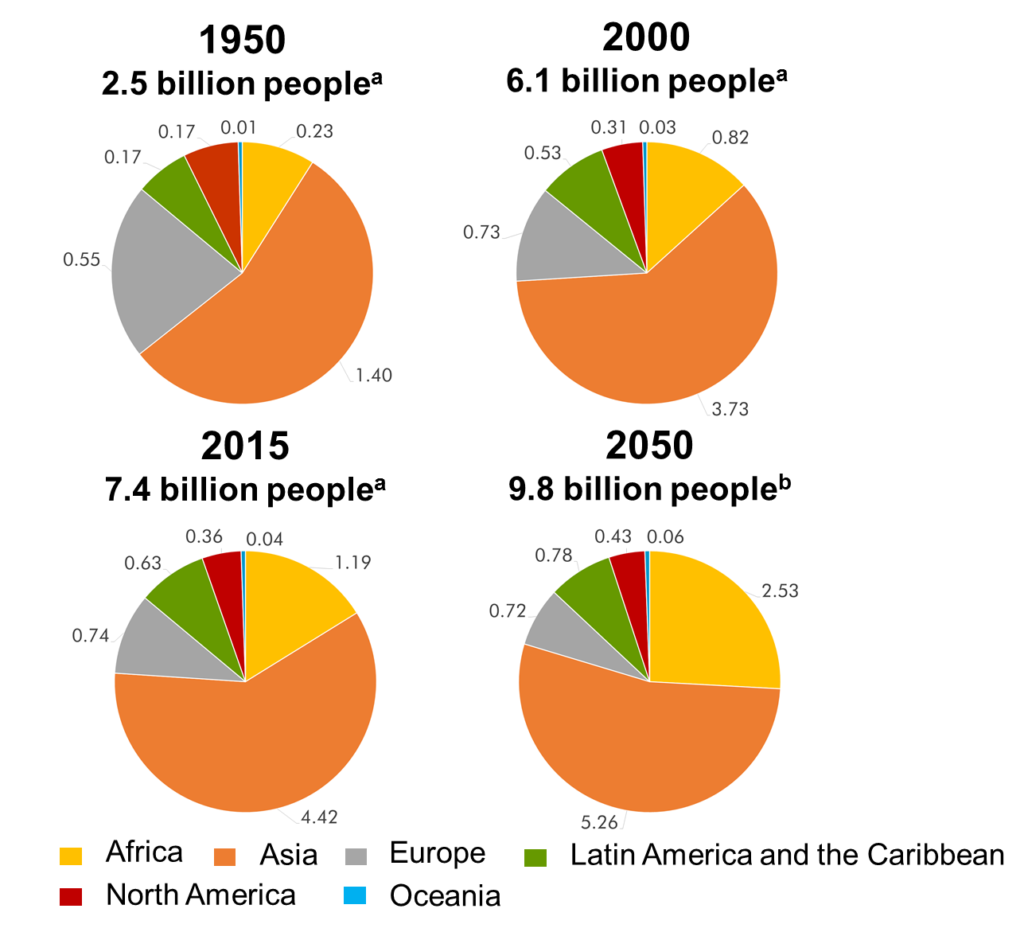
Source: http://www.un.org/popin/data.html

As you can see in the figure, in proportion, the European population seems to decrease (but in truth it remains steady from 2000 to 2050) while the population in Africa is increasing more than 10x when comparing 1950 to 2050.

The rest of the continents do not show drastic variations in proportion. However, the population in Latin America and Oceania will increase more than 4x, Asia almost 4x and North America more than 2x (global increase almost 4x) by 2050.3

Indeed, China and India have grown from 554 and 376 million in 1950 to 1.4 and 1.3 billion in 2015, respectively.3

Yes, huge numbers! So, how are we going to feed all those people? And what does it really mean?

The following videos (available in English with  subtitles in many languages) by Denis van Waerebeke  and the organization Feeding9billion clearly show the difficulties of feeding the growing population and how we can be part of the solution. Really worth watching!

But how do people eat?

Human diet is as diverse as are people and cultures around the world. There is no “ideal diet”, but there are ideal diets depending on the geographical location and the conditions of each region that provide the energy required to enjoy a healthy life.

This is a dish of “Mayón”, a worm that grows inside the trees in the Ecuadorian Amazon. Its flavor is similar to shrimp. It is accompanied by a piece of cassava and “encebollado”, an onion-tomato salad. The Kichwa population of the Amazon in the province of Orellana, goes out to sell the product in the city of El Coca in Ecuador. Photo by Karla Gachet.

There is an overall knowledge that a regular person should consume 2000 dietary calories or kilocalories per day (energy requirement). However, we did not find scientific proof explaining the calculation. If you find any, please let us know on the comments.

An accurate value for daily energy requirements should consider gender, age, body size, body composition and lifestyle and therefore, cannot be standardized to accommodate every person`s needs.4

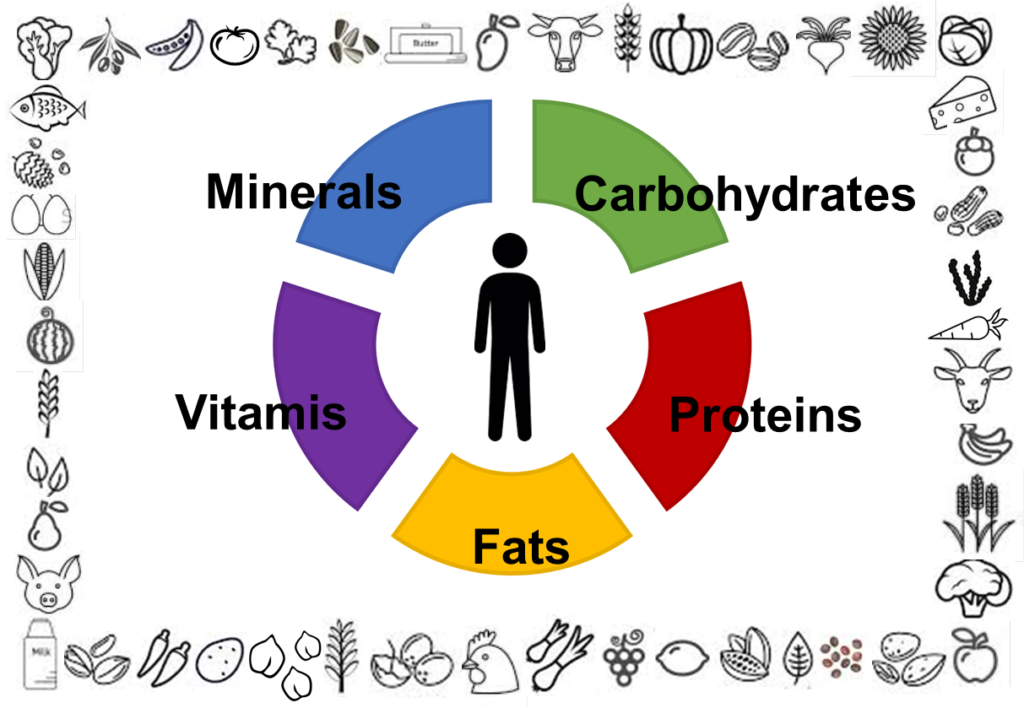
Food provides us the right mixture of nutrients (i.e. carbohydrates, fats, proteins, vitamins and minerals). Most foods are a mixture of nutrients; cereals for example are an important source of energy (carbohydrates and fats) but are also a source of vitamins and minerals.5

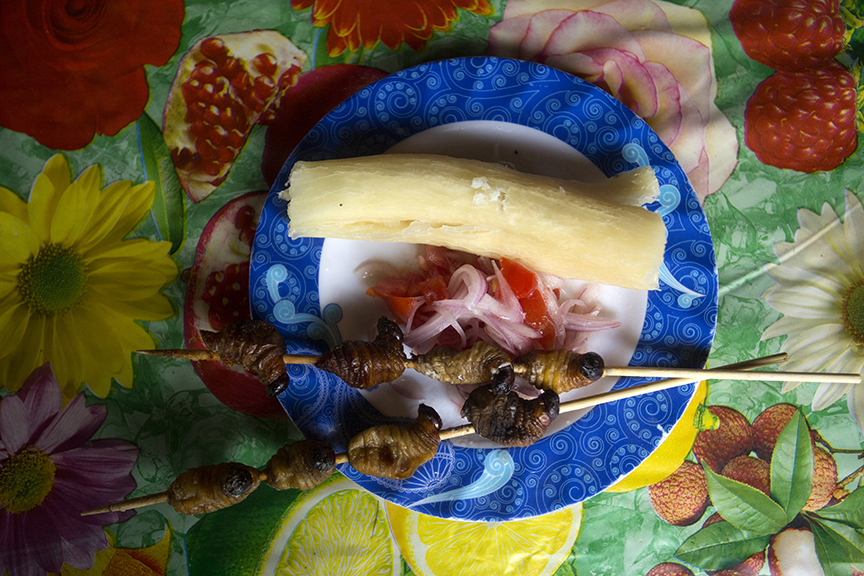
Photographer Gregg Segal shows nicely in his project Daily Bread, what kids around the world are eating allowing us to see not only how diverse food culture around the world is, but also the health value of home cooked meals in contrast to junk/processed food. Great pictures indeed!

It is very important to maintain cultural diversity (and diversity in general)! Imagine if we all eat the same things. It would be disturbing and also unsustainable! On this regard, the organization Slow Food, promotes the preservation of culinary traditions and the farming of local plants, seeds and animals. They are a global movement which acts locally. This is a great one to support!

How does human diet influence food security?

National Geographic6, using FAO information7, shows in simple illustrative graphics the consumption patterns of 22 countries around the world and how these have changed over a span of 50 years. On a global scale, between 1961 and 2011, the consumption of produce (roots with high starch content, vegetable and fruits), meat products and sugars/fats have increased. The figure below shows the world`s average daily consumption in both calories (cal) and grams (g).6

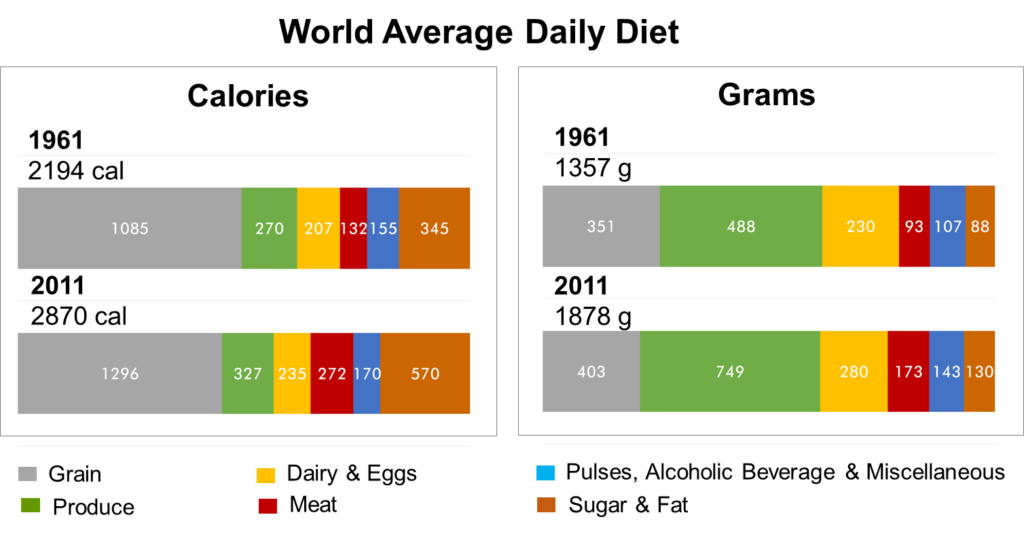
It is evident that a small portion of grain (e.g. 351 g) generates a lot of energy (1085 cal) and that a large amount of produce (488 g) generates little energy (270 cal).6 Please keep in mind that energy, in this case referred to as calories, does not mean “weight gain”. Energy is vital! You should be more concerned about the quality of the calories and to have a balanced diet rather than worrying about the number of calories itself. In the figure, we show the relation between calories and grams consumed daily per person6 in order to associate them later on with the food itself.

Just so you know: energy is measured in units of kilocalories (kcal) or kilojoules (kJ). A kilocalorie (1 kcal) equals 4.18 kilojoules (4.18 kJ). The numbers shown here in calories (cal) actually refer to kilocalories (kcal).

The figure bellow presents a better view of the impact of food consumption in China, India, USA, Brazil, Japan and Somalia in years 1961 and 2011.6

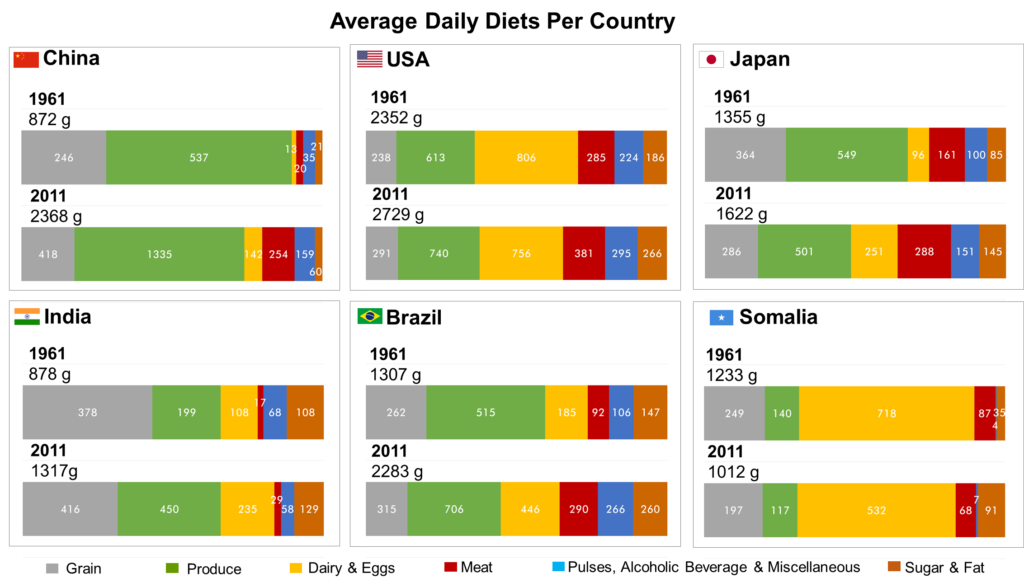
Interestingly, China not only increased almost 4x the amount of food consumption between 1961 and 2011, but also increased more than 10x the amount of meat consumption.6 If we think about this and the increase in population, we can imagine the impact on food security (China is just one example).

It is evident that the complexity of food security increases with increasing prosperity in the world. China and India, which are driving an increased demand for food, especially meat, eggs and dairy products,6 subsequently increasing the pressure to produce more maize and soybeans to feed cattle, pigs and poultry.

This change in habits (specially the increased demand for animal derived products) is also evident in emerging economies all around the world. If we think about it, Brazil, for example, has more than tripled (3x) this meat production in 50 years. Other examples can be found in the National Geographic study.6

If these trends continue, the impact of population growth and diets with a greater animal component will require doubling agricultural production by 2050.

Worth reading on this regard is the Five-step plan to Feed the World proposed by National Geographic.

It is also alarming to think about the excessive and indiscriminate exploitation of the oceans to meet the needs of emerging economies. China, for example, has recently been involved in massive, non-selective and illegal fishing events in Senegal8, Ecuador9 and other Pacific countries10.

A recent study in West Africa shows that illegal fishing accounts for 65% of reported catches which puts food security and the region’s economy at risk.11

Kids help their parents fish off the island of Limones, province of Esmeraldas, Ecuador. Photo by Karla Gachet.

But what exactly does this mean for the local people?

Have a look at the short film Nonoy and the Sea Monster to understand the magnitude of the impact…

An interesting approach to fight against intensive fishing is the European project Fish Forward. The project aims to raise awareness about the social and environmental impact of fish consumption. It targets consumers and their willingness to contribute in changing this situation by choosing to buy sustainable fish. 

The way we consume food is endangering biodiversity and human health. A new regenerative food system model it is required, a circular one.12

Conclusion

The problem of the food in the world is complex, it affects all the inhabitants of the earth. It does not require a single hero or a magic formula, it requires the work and creativity of each one of us. Together we can solve it and build a healthy and fair world with food for all.

If you want to be part of this movement, stay tuned! We are going to talk a lot about the food problems in the world, how we can be part of the solution and the initiatives that are contributing to a better world.

By M. S. Gachet et N. Zanuto
Link to initiative here.

REFERENCES:
1 FAO, 2011: La seguridad alimentaria: información para la toma de decisiones. Guía práctica.
2 FAO. How to Feed the World in 2050
3 UN: United Nations. United Nations Population Information Network.
4 FAO, 2001: Human Energy Requirements.
5 FAO. Chapter 7: Food, nutrients and diet.
6 National Geographic. What the World Eats.
7 FAO. Food and agriculture data.
8 China Wants Fish, So Africa Goes Hungry. New York Times. Mayo 3, 2017.
9 WWF se pronuncia sobre la captura del buque chino en Galápagos. Diario EL COMERCIO.
10 China’s Appetite Pushes Fisheries to the Brink. New York Times. April 30, 2017.
11 Doumbouya, A. et al., 2017. Assessing the Effectiveness of Monitoring Control and Surveillance of Illegal Fishing: The Case of West Africa. Frontiers in Marine Science 4:50.
12 Ellen Macarthur Foundation, 2019: Cities and Circular Economy for Food.

Food Wastage and Its Impact on the Health of the Planet

One third of the food produced for human consumption is lost or wasted every year (FAOs estimation (Food and Agriculture Organization of the United Nations)). This is approximately 1.3 billion tonnes, an average of 265 Kg/person/year and 750 billion US dollars per year (equivalent to the GDP of Switzerland).1,2

With the food produced and not consumed (wastage) today, we could eradicate hunger!3

How does this happen?

To understand how and why food is wasted and what we can do to help change this situation what, let’s first understand how our food is produced.

As mentioned in post 2, to produce food we need: essential elements that form all living organisms (carbon, hydrogen, oxygen and nitrogen), water, soil and biodiversity.

If we think about it, the food production itself is consuming a lot of natural resources, right? 

Food production not only requires natural resources, but also energy for postharvest handling and storage, processing and distribution up to consumption. Now imagine if we do not consume this food, how big would the wastage be? How can this impact, this footprint, be measured?

The Environmental Footprint of Wastage

Just to make it clear, the famous “environmental food footprint” is the energy and resources required to produce food and is evaluated using four indicators: the carbon footprint, the blue water footprint, land occupation and the impact on biodiversity.1,2

Now, in the picture below, you can see some really impactful numbers which demonstrate how large the food footprint of wastage is. To highlight some of these numbers, imagine a person riding in a car for 2.300 Km every year (almost the distance between New York and Las Vegas). This is the approximate carbon footprint of one person; or 3x the volume of water of Lake Geneva. This is the water consumed to produce food wastage in the world (the blue water footprint) per year; or in terms of land use, we can attribute it an area that corresponds to the size between Russia and Canada, approximately 28% of the total world area!1,2 

The equivalent of 6 garbage trucks of edible food is lost or wasted every second!4

1 Ha (hectare)= 0.01 Km2

Food with the Highest Environmental Impact on Food Wastage

To identify the impacts of food wastage on natural resources and where and why these impacts occur, FAO has grouped food in eight food commodities:

1. Cereals (excluding beer),
2. Starchy Roots,
3. Oilcrops and Pulses,
4. Fruits (excluding wine),
5. Meat,
6. Fish & Seafood,
7. Milk (excluding butter) & Eggs and
8. Vegetables. 

The study shows that cereals and vegetables have the greatest environmental impact for the carbon footprint, the blue water indicator and the land occupation accounting for around 50% in all cases.1,2 

Regions with the Highest Environmental Impact on Food Wastage

As already mentioned in post 2, farming (conversion of wild lands and intensification) is the major threat to biodiversity globally. It is important to note that this occurs mostly in developing regions (72% and 34% of species are threatened by crops and livestock production, respectively, versus 44% and 21% occurring in developed countries). Deforestation due to agricultural expansion occurs mainly in tropical and subtropical regions of Africa (62%), Latin America (25%) and Asia (13%)1,2 and has destroyed 5.2 million Ha/year between 2000 and 2010 (the net annual loss of forest equivalent to an area about the size of Costa Rica)5.     

In financial terms, the food wastage with greater economic impact are vegetables and meat accounting for around 170 and 160 billion US dollars per year, respectively. 1,2 

In order to compare the impact by region, FAO has also divided the world into seven regions with similar food cultural behavior, economic and social backgrounds, which are shown in the figure bellow1,2:

Remarkably, the regions of North America & Oceania, Industrialized Asia and Europe have the highest per capita carbon footprint of food wastage (903, 741 and 686 Kg of CO2 eq./person/year, respectively).1,2

The wastage of cereals in Asia (especially rice and wheat) emerges as a significant environmental hotspot showing high impacts on the carbon footprint (Industrialized Asia with 14% and South & Southeast Asia with 11%), blue water footprint (13% and 24%) and arable land occupation (5% and 9%). Fruits wastage emerges as a blue water hotspot in Asia (Industrialized Asia with 3% and South & Southeast Asia 4%), Latin America (3%) and Europe (3%). While the carbon footprint of vegetables emerges as a hotspot in Asia (Industrialized Asia 10% and South & Southeast Asia (3%) and Europe (4%).1,2

As you can see, wastage of cereals and vegetables have the most significant environmental impact resulting in the highest global footprint of carbon, water and land occupation. 

The Food Life Cycle

So, why do we let all of these important natural resources get lost? To answer this question, let’s have a look the following graphic that explains the life cycle of food and the sources of food wastage. 

As you can see, food is lost along the entire food supply (agricultural production + postharvest handling and storage = 54% and processing + distribution + consumption = 46%). The later the phase of the life cycle, the greater the impact due to its unnecessary production and transformation.1,2

If we throw away an apple pie, its environmental footprint will be higher than to waste the apples collected at the field, right?

How and Why Food is Being Lost

The food losses are mainly caused by inefficiencies in the food supply chains (such as poor infrastructure and logistics, absence of technology, insufficient skills, knowledge and management capacity and lack of access to markets) and natural disasters. 1,2

Within the food life cycle, food losses refer to agricultural production (stage 1 of the food life cycle) and postharvest handling and storage (stage 2 of the food life cycle). 1,2 Individuals alone hardly have the power to contribute to improve food losses, but together, we can have an impact!

On the other hand, food waste is caused by spoilage of food (food kept beyond its expiry date or left to spoil) and oversupply due to markets, or individual consumer shopping or eating habits. The food waste is the food appropriate for human consumption that is being discarded. Within the food life cycle, food waste refers to processing (stage 3), distribution (stage 4) and consumption (stage 5).1,2 Each one of us can do something to improve food waste.

Note: in English there is a word to define total food waste (food wastage) which refers to food losses in the stages 1 and 2 and food waste in the stages 3, 4 and 5 of the food life cycle.

Now, we should know that the food wastage is different depending on the region. Developing countries suffer more food losses during agricultural production. However, food losses during agricultural production (stage 1) and postharvest handling and storage (stage 2) are similar in all regions in the world accounting for approximately one third of the food wastage of each region. Meanwhile, in mid- and high-income regions, the food wasted tends to be greater at consumption level. In fact, food wasted during processing (stage 3), distribution (stage 4) and consumption (stage 5) represents 31-39% in mid- and high-income regions while in low-income regions accounts only 4-16%.1,2

The entrails of a llama are found in a bucket at the Oruro Carnival. During the party, many people sacrifice llamas and make offerings to show their dedication to the Devil, the Virgin, Pachamama or Mother Earth. Photo by Karla Gachet.

Another important point to consider when talking about food wastage is the so-called “ugly food” mostly referring to fruits and vegetables, but also animal parts. Only for aesthetic reason, markets and people prefer consuming “beautiful and impeccable” produce and as a consequence, huge amounts of “perfect food” is being thrown away!

Food Wastage Volume per Region

Each region of the world has its own profile in terms of food wastage (quantities and type of product). In the figure below we can see some numbers:1,2

The world region with the biggest impact regarding wastage volumes is Asia with the highest wastage of vegetables (Industrialized Asia with 11% and South & Southeast Asia with 4%) and cereals (16% in total). Sub-Saharan Africa, Industrialized Asia and Europe wastage volume is high regarding starchy roots (5%, 4.5% and 4%, respectively) and South & Southeast Asia and Latin America regarding fruits (4% and 3%, respectively).

Interestingly, Industrialized Asia food wastage is lower in percentage than other high-income regions. The high wastage volume is because this region dominates the world vegetables production and consumption, with more than 50% of both.

Also keep in mind that in Asia today is where 60% of the population lives!

In Sub-Saharan Africa region, the high wastage of starchy roots at a global level is because of high volumes of losses in the agricultural and post-harvest phases (stages 1 and 2).1,2

In terms of food wastage per person, in the top 5, we find Industrialized Asia for vegetables (~115 Kg/person/year), Sub-Saharan Africa for starchy roots (~110 Kg/person/year) North Africa, Western Asia & Central Asia for vegetables (~95 Kg/person/year), Latin America for fruits (~90 Kg/person/year) and Europe for starchy roots (~85 Kg/person/year). Interestingly, when comparing with total food wastage volumes, South & Southeast Asia region is no longer on the top of the list. In fact, it has the lowest food wastage volumes per capita.1,2 

La Vega Central market in Santiago de Chile also known as “Feria Mapocho”. From the colonial time, farmers gathered in the area of “​​La Chimba” to sell their products. Today hundreds of thousands of people pass through La Vega Central daily. Many of the stalls have been inherited from parents to children. Photo by Karla Gachet. The full story can be found here

These big numbers in South & Southeast Asia and Africa, also represent the food that is being wasted due to the lack of proper storage possibilities. To address this needs, Evaptainers and Wakati are building innovative cooling systems. It’s worth checking them out! 

As we can see, in each region of the world the problem of wastage considers many factors and is different for each region!

Conclusion

Food wastage is a serious problem for which we are all responsible. Our consumer footprint has an impact. Our food is connected with the earth, the watersheds, the climate and the people who produce the food we eat. Only by becoming aware of our contribution will we have the right tools to make decisions that will allow us to build a sustainable world. 

Around the world there are local movements using different strategies to fight food waste. Here there are several examples:

Food for Soul, born in Italy, is one we love. Their approach involves chefs and their knowledge to transform ordinary ingredients (surpluses of food that otherwise will be wasted) into extraordinary dishes that will be served to the poorest, fighting like this against food waste while promoting social inclusion. You will probably think that this kind of strategy would only work in developed countries however, one of these centers Gastromotiva, is running in Rio de Janeiro, Brazil.

Stop Wasting Food is a Danish movement, that started by raising consumer awareness and in 5 years it has become the largest non-profit consumer movement against food waste in the world. They teamed up with the country’s biggest low-cost supermarket chain to replace all quantity discounts with single item discounts to minimize food waste, promote the opening of food surplus supermarkets, outreach programs to the homeless, and with a greater focus is involving the industry, retailers, canteens, restaurants and foodservices in the fight against food waste. Many practical tips to reduce food waste can be found on their website. It is really worth checking them out!

France is taking action at a political level and has passed a law forbidding supermarkets’ food waste. Food needs to be redistributed/donated before it goes bad, otherwise supermarkets will get fines.

Costa Rica is also taking action at a political level with a well-structured plan of action; have a look here.

Involving the community, the movement Re-food in Portugal, is collecting the surpluses from restaurants and with the help of volunteers, taking them to people in need.

Involved supermarket Chowberry in Nigeria has created a new sustainable food chain out of products approaching end of shelf-life allowing consumers to see their availability and discounted prices in real-time. This discounted food is obtained by charities and NGOs helping tackle food poverty.

In most countries of Latin America, non-profit organizations known as Banco de Alimentos are collecting food that, for various reasons, would be discarded. Just type on google: banco de alimentos + “country name” to find them. 

If we think about it, in Latin America and the Caribbean for example, with the food that is being lost only in terms of retailing (supermarkets, street markets, shops and small retail) more than 30 million people, that represents 64% of people suffering from hunger in the region, could be fed.6

Let’s stop food waste!     

We do have the power as consumers!

We can buy only what we can eat, store and eat our leftovers, think that more is not always better by preferring quality over quantity, share surplus food and at restaurants, order only what you can eat and if you can’t finish your meal, take the leftovers home.

We can also choose to buy that apple that does not have the nicest color, that broccoli that has a weird shape, and by doing this you will be, nice and slowly, pressuring the system to change this rule that tells what kind of vegetables and fruits can be sold at the market, otherwise it goes to the trash (wastage). Also keep in mind also that the fruit with the little holes from the worms might be the most delicious. Nature recognizes food quality much better than we do. And that the perfect shape pear might have been treated so that it remains as perfect as you want it… 

To help decrease the numbers from food wastage relating to non-consumption, you can use all of the parts of the produce you buy, the leaves of the carrots and the stem of the broccoli can help to make a rich vegetable broth for example. By doing so, you can always eat everything you buy! It is that simple.

And remember that “nature does not waste anything”. Let’s start thinking about waste as resources and build a new economy, a circular one. Take a look at Ellen Macarthur Report, Drawdown and ZERI and get inspired.

By M. S. Gachet et N. Zanuto
Full story of the cover photo can be found
here.

REFERENCES:
1 FAO, 2013: Food Wastage Footprint. Impact on Natural Resources.
2 FAO, 2013: Huella del desperdicio alimentario – Impacto en los Recursos Naturales. Presentación del estudio de la FAO FWF.
4 Ellen Macarthur Foundation, 2019: Cities and Circular Economy for Food.
5 FAO. World deforestation decreases, but remains alarming in many countries.
6 FAO. Losses and food waste in Latin America and the Caribbean.